Social media analytics for every network in one dashboard
Reach, engagement, engagement rate and follower growth, compared with the previous period, plus your best days and hours to post and a report you can export.
Orbin’s analytics dashboard brings reach, engagement, engagement rate and follower growth from your connected networks into one view. Compare any period with the one before it, see which days and hours earn the most engagement, drill into a single post, and export a CSV report or print to PDF.
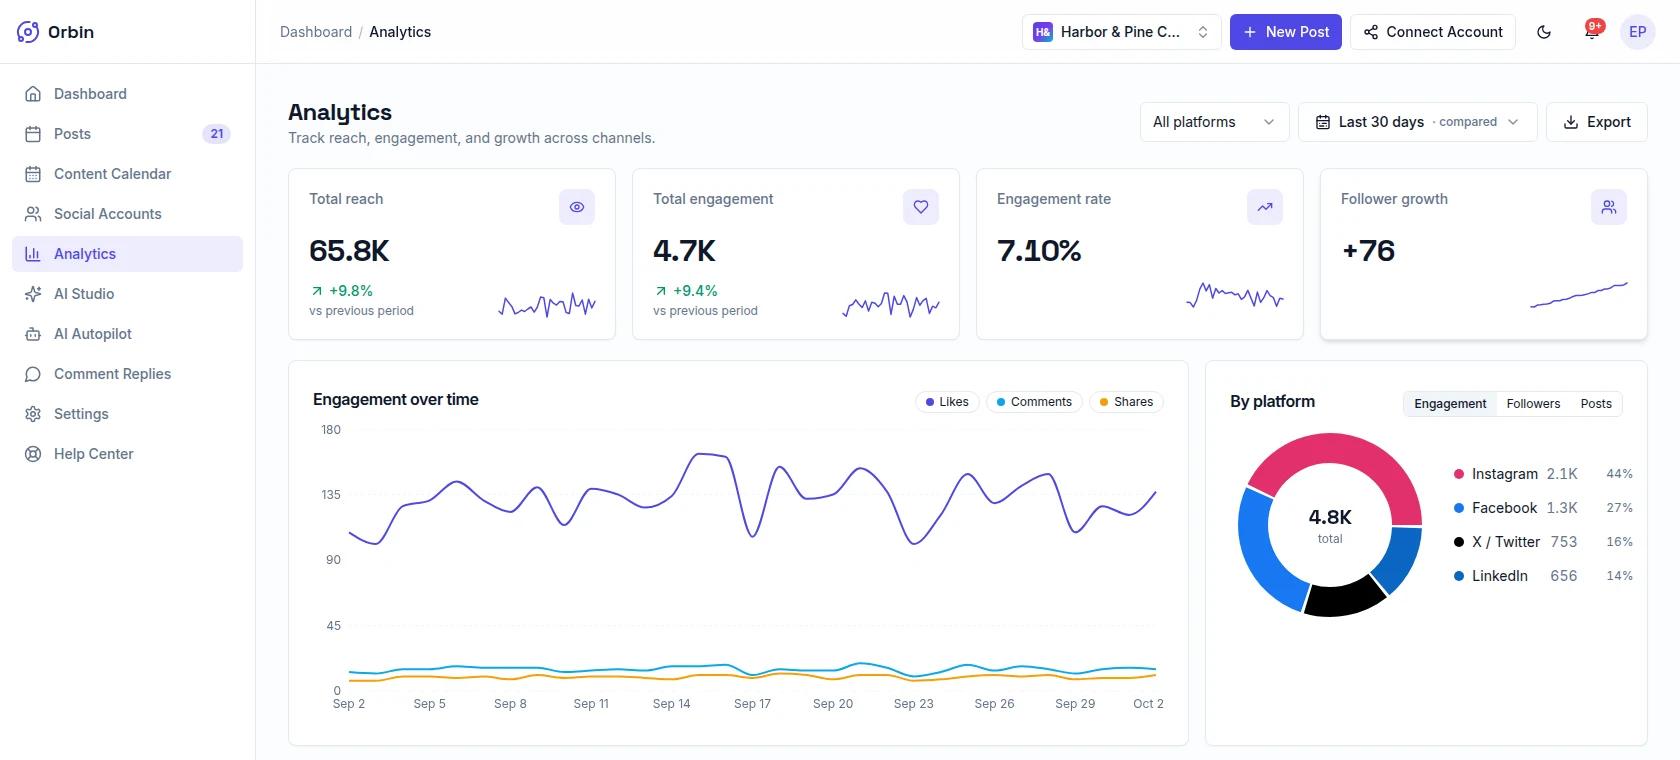
Screenshots show sample data from a fictional workspace.
How the analytics dashboard works
Connect and publish
Connect your accounts and publish through Orbin. Numbers appear once your accounts have published posts, and can take a day or two to populate.
Choose a range and a network
Pick the last 7, 30 or 90 days, all time, or a custom start date, and turn on comparison with the previous period. Select a network to focus on it.
Read the charts
Follow engagement over time, see how your networks compare, and check the heatmap for the days and hours that perform best.
Drill in and export
Open any post for its own numbers, or export a CSV report or print the dashboard to PDF to share.
What Social Media Analytics includes
Headline metrics with trends
Total reach, total engagement, engagement rate and follower growth, each with a trend line, and reach and engagement can be compared with the previous period.
Engagement over time and by network
A daily engagement chart shows spikes and slumps, and the network breakdown shows where your engagement comes from. Click a network to filter the top-posts table to it.
A best-times heatmap
A day-of-week by hour grid shades each slot by the engagement your published posts earned there, and highlights your strongest window.
Top posts and per-post analytics
A sortable table ranks your posts by likes, comments, shares or engagement rate. Open a post to see its reach, impressions, likes, comments, shares and clicks, with a breakdown by network.
Reports you can share
Download a CSV with summary totals, a per-network breakdown and your top 25 posts, or print the dashboard to PDF from your browser.
Honest numbers
- No invented data. Audience demographics, top locations and device types are not collected yet. The post analytics page labels them as coming soon instead of showing made-up figures.
- Clear about freshness. Account figures refresh once a day. Accounts that published in the last 24 hours also get hourly engagement updates, because a post’s numbers move fastest on its first day.
- Based on your own posts. The best-times heatmap summarises what already happened on your account. It needs published posts, and shows an empty state until you have some, rather than guessing.
Good to know
- Analytics are collected for Facebook, Instagram, X, and LinkedIn.
- Heatmap times are in UTC, so convert them to your own time zone before scheduling around them.
- The plan table above shows which analytics tier each plan includes.
- The heatmap describes the past. For a score on a draft you have not published yet, use engagement prediction.
Social Media Analytics by plan
| Plan | Social Media Analytics |
|---|---|
| Starter | Basic |
| Professional | Advanced |
| Business | Advanced |
| Enterprise | Advanced |
Every plan starts with a 14-day free trial. Compare all plans →
Frequently asked questions
What does Orbin’s social media analytics show?+
Reach, engagement, engagement rate and follower growth across your connected networks, an engagement chart over time, a network breakdown, a best-times heatmap, a top-posts table, and analytics for each individual post.
How often is the data updated?+
Account figures refresh daily. Accounts that published in the last 24 hours are also refreshed hourly, because new posts gain engagement fastest at first.
Can I export my analytics?+
Yes. Download a CSV report with summary totals, a per-network breakdown and your top 25 posts, or print the dashboard to PDF from your browser.
Is the best-times heatmap a prediction?+
No. It summarises the engagement your own published posts earned in each day-and-hour slot. It is a record of what happened, shown in UTC, and it needs published posts to fill in.
Does Orbin show audience demographics?+
Not yet. Demographics, top locations and device types are not collected, so the dashboard does not display them.
Want the full walkthrough? Read the step-by-step guide →
Explore more of Orbin
Engagement Prediction
Score a draft post from 0 to 100 and see estimated likes, comments and shares before you publish, with insights and suggestions to improve it.
Learn moreContent Calendar
Plan every post on a month, week or day calendar. Filter by network, drag to reschedule, and see drafts, scheduled and published posts in one place.
Learn moreAI Autopilot
Orbin AI Autopilot scans your website, then drafts and schedules on-brand social posts every week across your networks, with review before anything publishes.
Learn moreTry Social Media Analytics free for 14 days
A card is required to start, and you won't be charged until the trial ends. Cancel anytime before then.
Start free trial